Workflows and their related concepts
Workflows in Comfy Deploy represent your ComfyUI workflows that you’ve uploaded and want to use in your own applications.Workflow Verisons
Workflows have versions. Versions let you iterate on your workflows
without losing track of previous work.
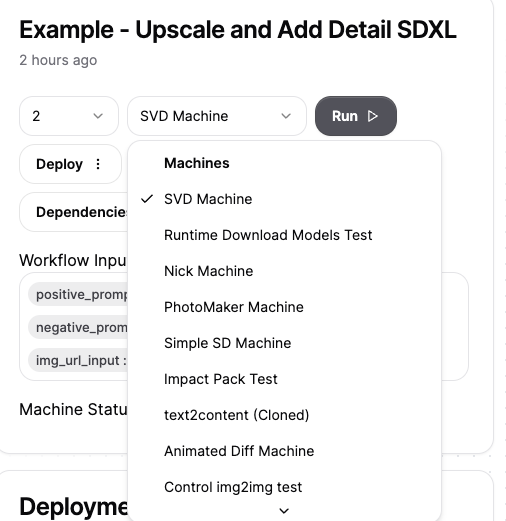
Machines
Your workflows run on a machine learn more here
The custom nodes your workflow depends on should be installed into your machine.
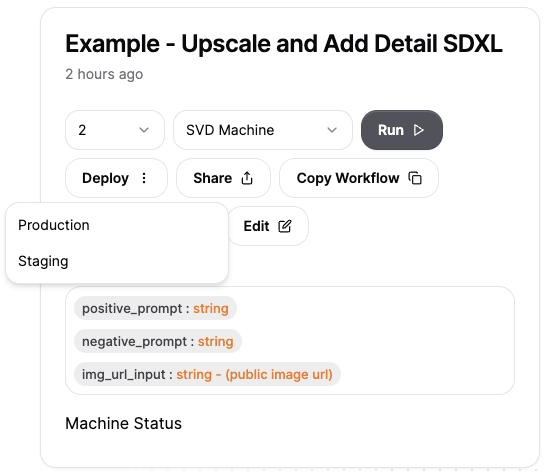
Deployments and APIs
Deployments are how you can expose your workflows as APIs! Select your
version and machine. Then select either “production” or “staging” for
your deployment
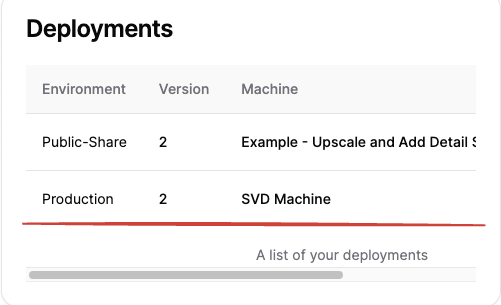
You should see a deployment popup shortly in the bottom left, this means your
deployment is live!
Integrating your Workflow API
When you click this you’ll find code snippets to integrate your Comfy workflows with your applications with a simple API call. If you’re usingjs/ts you can install our SDk
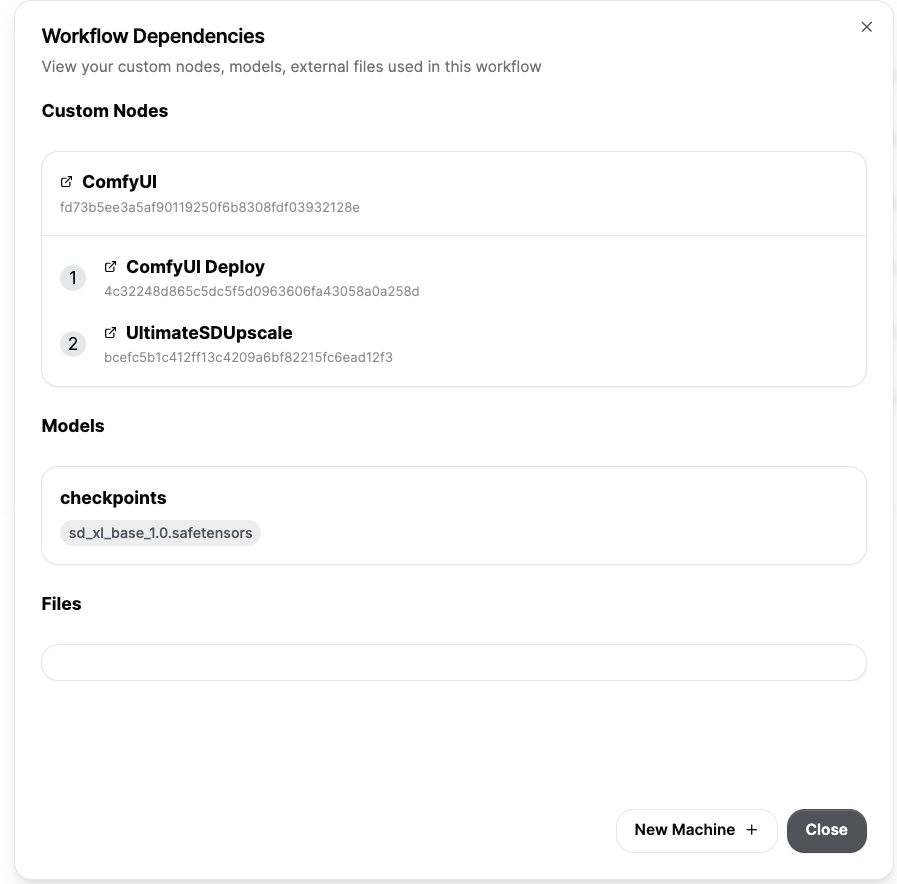
Dependencies
Dependencies are the models, static assets and custom nodes that
you need to run your workflows. We figure this out based on your local
environment and collect them so that you can get up and running quickly.
Currently we don’t get all the dependencies but we do get a lot of the obvious
ones out of the way.
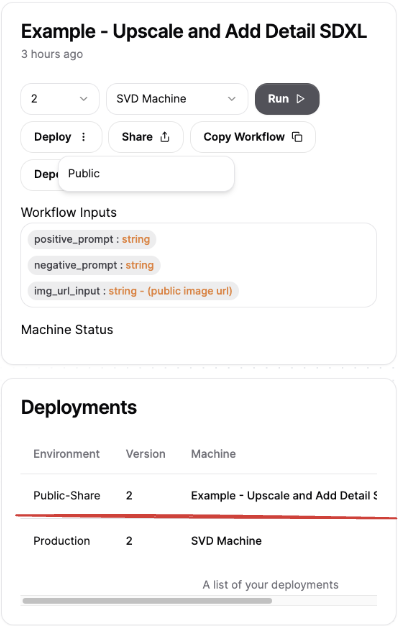
Public Share
Public share is a way that you can quickly share your workflows with your
teammates or prospective clients.
Selecting “public”, it will show up in your “deployments” section.
Selecting “public”, it will show up in your “deployments” section.
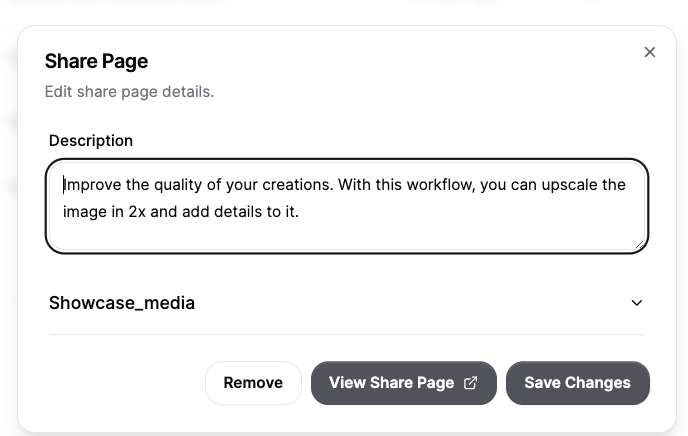
When you click the public share tab in the deployment section, a popup with
fields to customize your Share page will show up. You’ll be able to add a -
description of your workflow, - a “cover photo” to showcase. - The title of
the page will be the name of the workflow. - Users will be able to test out
the workflow, with the inputs you defined
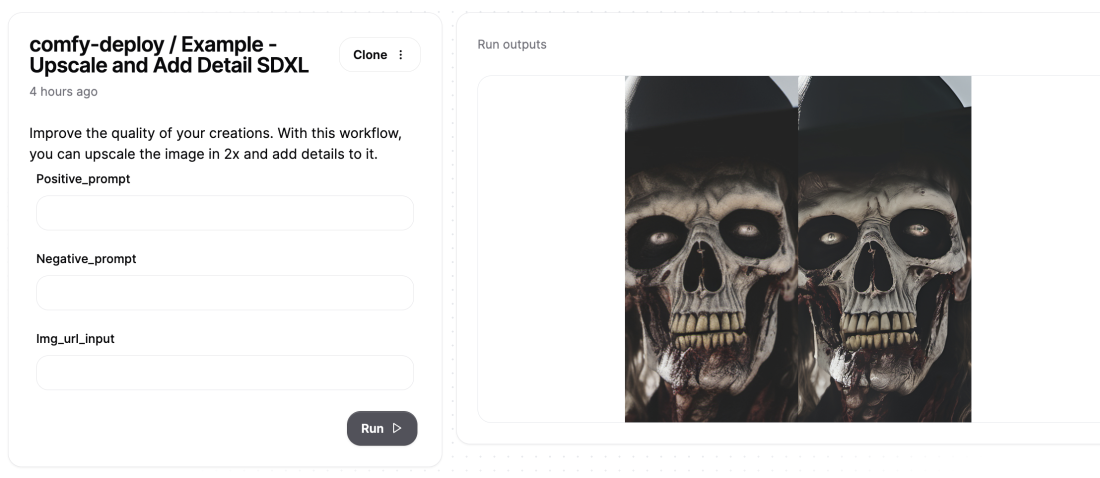
Your view share page will look something like thisCheck out this examples page for Comfy Deploy workflows! (They use sharepages!)
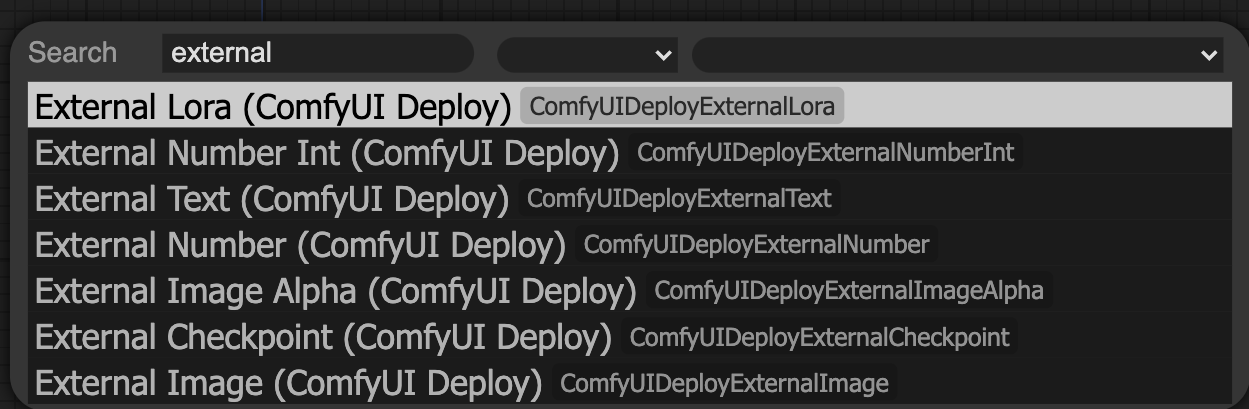
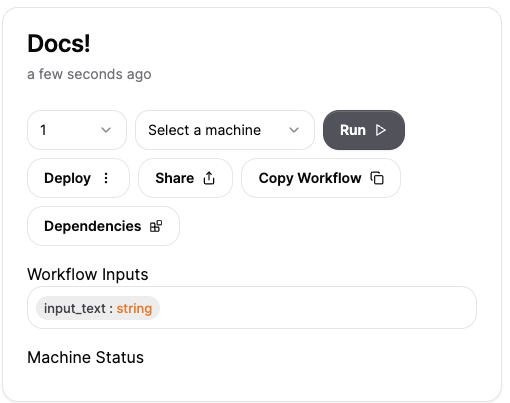
External inputs
External inputs are how you define the inputs of your deployed APIs! This is
done by connecting Comfy Deploy’s “External nodes” to your existing workflows.
You can find them by searching “external” for in your ComfyUI
Setting External Inputs
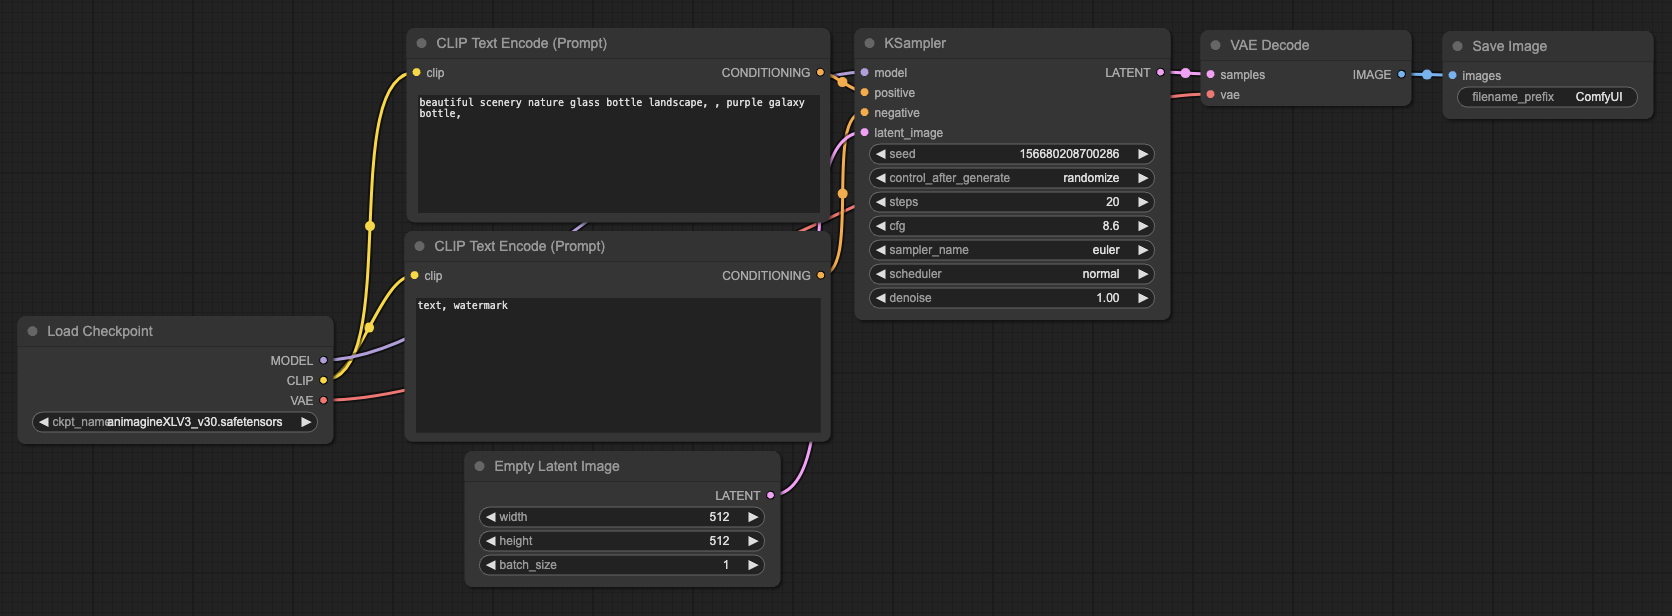
Let’s say this is my workflow If I wanted to make it so that the positive
prompt was an external input.
- Right click and select “Convert text to input” (this option is availble to all your input values).
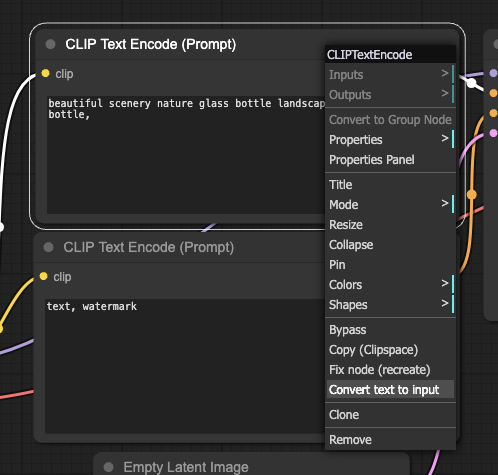
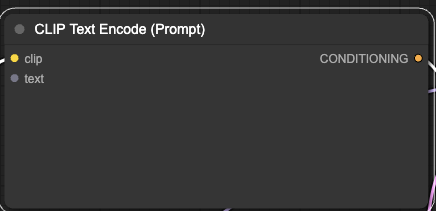
2. Then you’ll see that the value has turned into an input value
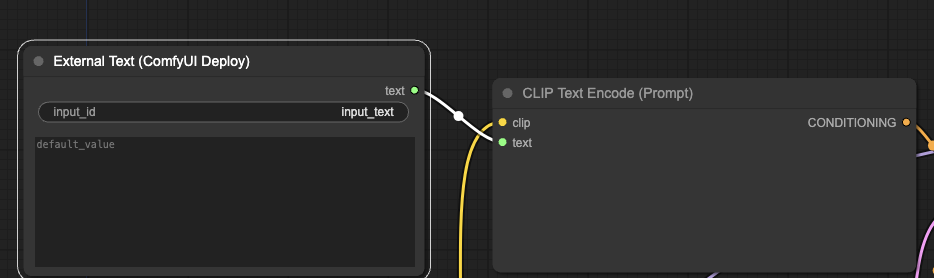
- Connect the Comfy Deploy “External text” node to it. Optionally write a default value
- Then deploy!
Now you understand where you can set workflow inputs!
Outputs
Outputs are determined by “Save image” and “Preview img” we allow differnt types of outputs..png.jpg/jpeg.webp.octet-stream
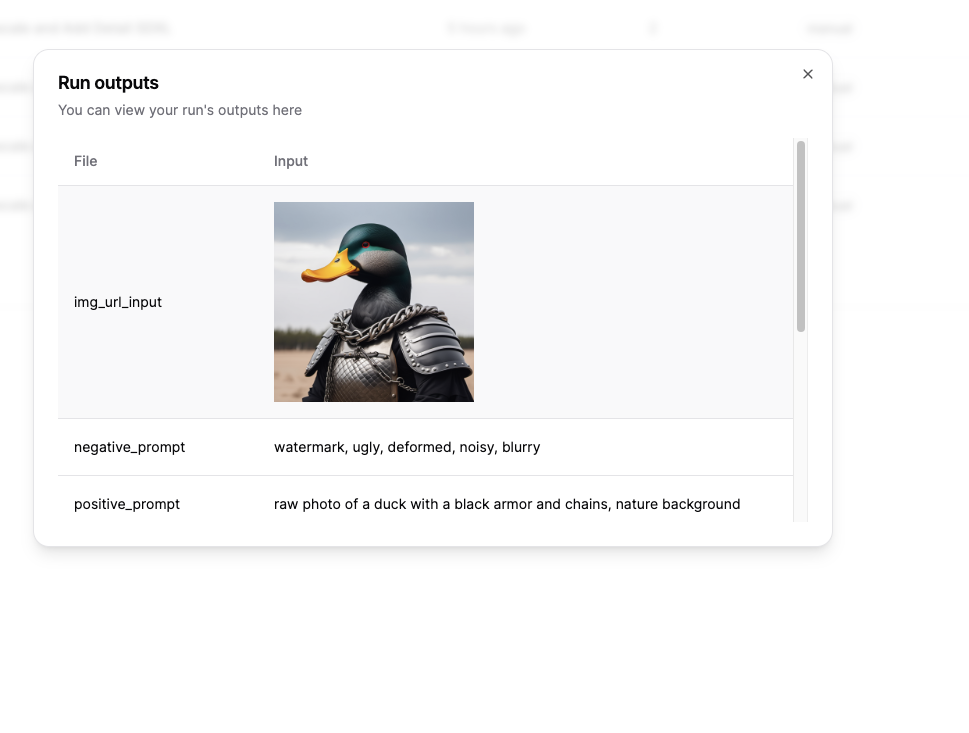
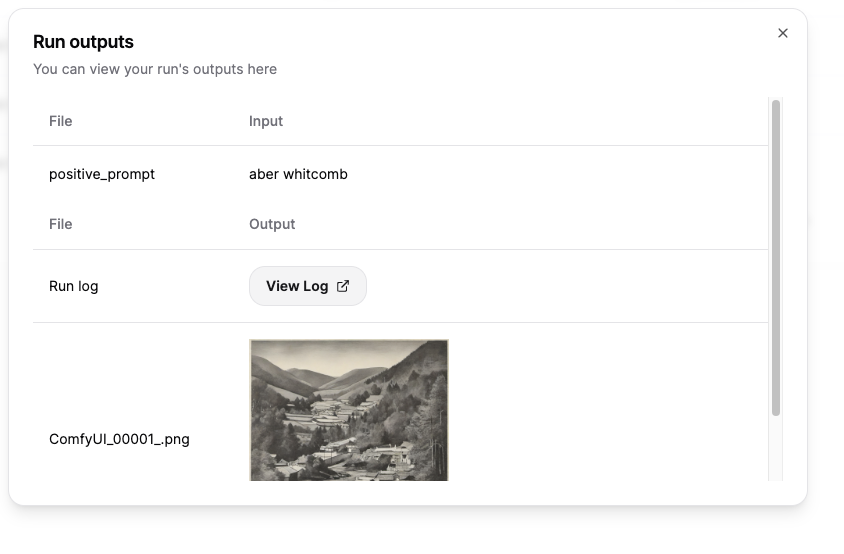
Observability
Workflow observability means being able to undersatnd what happens on your
runs. What you see here is the inputs given, a link to the logs as well as the
final output.
Also you are able to see the time spent in the different operations. As well
as the fine grained breakdown if you hover over the Duration.
